
Overview
Tired of sifting through endless lines of text to find that elusive bug in your iOS app? For macOS users and iOS developers, a new contender has emerged to revolutionize your debugging workflow. Better Logger is a powerful, modern macOS log viewer meticulously crafted for the intricacies of iOS development. Launched on Product Hunt on December 7, 2025 (achieving 160 upvotes, 15 comments, and ranking #5 for the day), Better Logger addresses fundamental frustrations plaguing iOS debugging: Apple’s Console.app presents monolithic, chronologically ordered log streams mixing system and application logs making relevant information difficult to isolate; traditional log viewers lack visual organization requiring manual filtering through thousands of entries; and disconnected debugging workflows prevent AI-powered development tools from accessing live application state during troubleshooting.
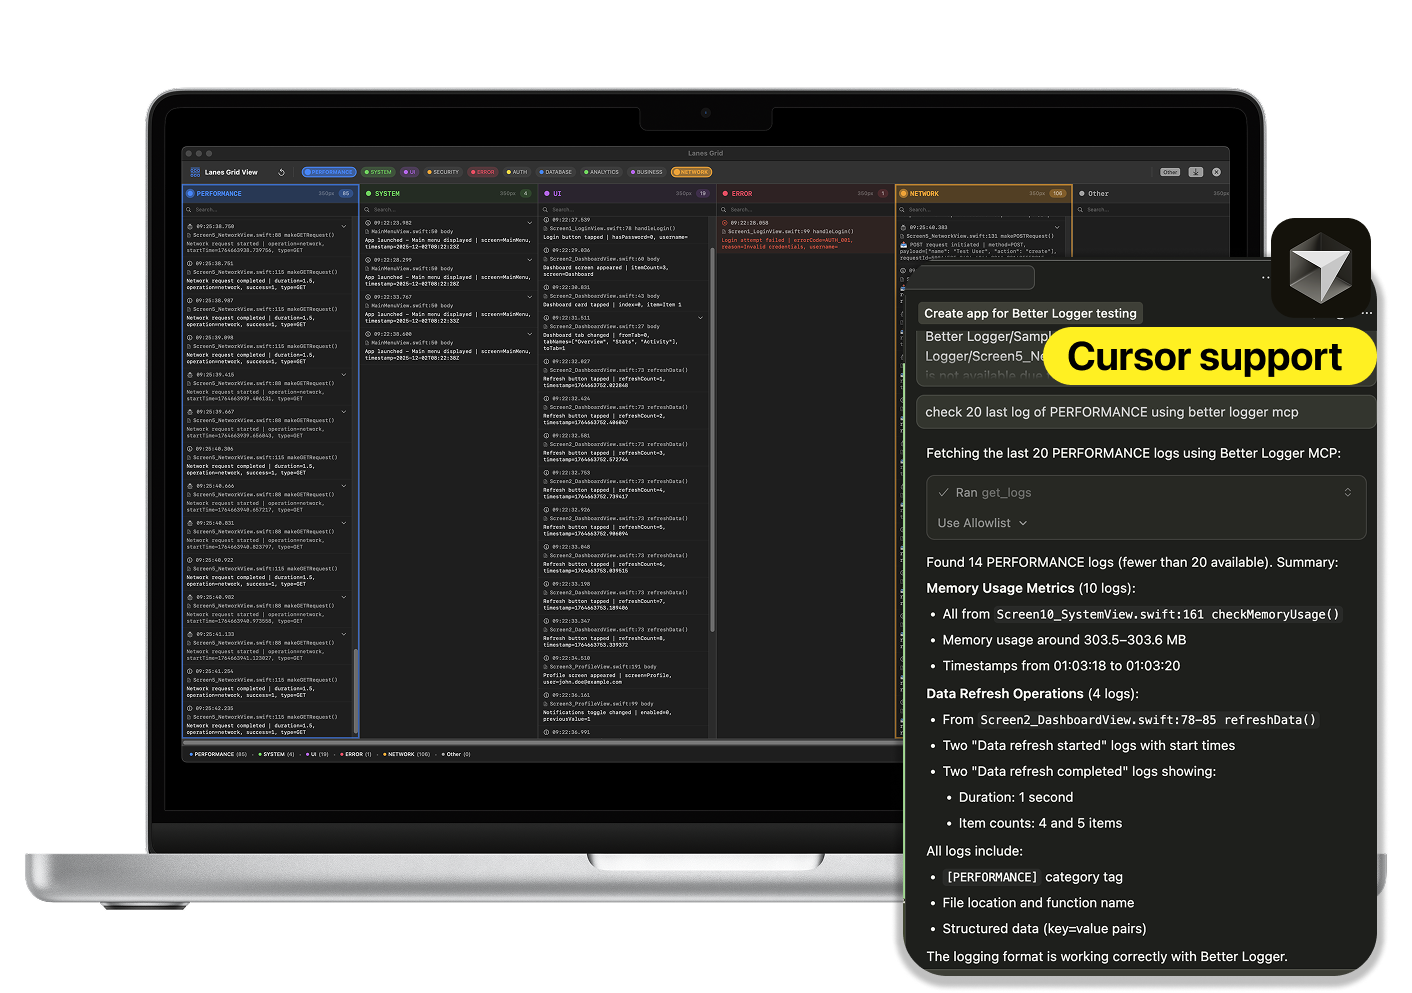
Built as native macOS application using SwiftUI requiring macOS 14.6 (Sonoma) or later, Better Logger provides real-time iOS Simulator log streaming with automatic simulator detection, visual “lanes” organizing logs into color-coded categories for instant clarity, Model Context Protocol (MCP) integration enabling AI assistants like Cursor to analyze live logs, memory and CPU monitoring tracking performance metrics, and export capabilities sharing findings in Markdown, JSON, CSV, or text formats. It promises to streamline how you monitor, organize, and even leverage AI to tackle those frustrating issues, offering significant upgrade over traditional methods.
Key Features
- Real-Time iOS Simulator Log Streaming with Automatic Detection: Watch your app’s logs unfold live directly from iOS Simulators, eliminating delay and guesswork of post-run analysis. Better Logger automatically detects active iOS Simulators leveraging macOS system frameworks (Apple’s simctl command-line tool and Core frameworks for simulator management) establishing direct connections streaming system and application logs instantly. The low-latency data transfer ensures developers see log entries appear live as their app executes within simulators enabling immediate issue identification. This real-time capability transforms debugging from reactive analysis of captured logs to proactive observation of application behavior as it unfolds.
- Visual “Lanes” for Intelligent Log Organization: Go beyond single, monolithic log stream cluttering traditional console applications. Better Logger employs advanced log parsing heuristics automatically categorizing incoming entries based on content, subsystem, process, or custom patterns. Each category receives distinct, color-coded visual lane within UI creating instantly recognizable organization patterns. Developers dynamically toggle lanes on/off isolating specific log types (network requests, error messages, specific modules, third-party frameworks) drastically reducing visual clutter and focusing attention on relevant information. The Free tier supports up to 2 lanes; Pro version unlocks unlimited lanes enabling comprehensive organization for complex applications generating diverse log types.
- MCP (Model Context Protocol) Integration Enabling AI-Assisted Debugging: This represents cutting-edge capability distinguishing Better Logger from traditional log viewers. Better Logger exposes suite of 7 specific MCP tools (list_devices, list_sessions, list_lanes, get_logs, get_session_logs, start_log_stream, stop_log_stream) allowing MCP-compatible IDEs like Cursor to programmatically interact with Better Logger. Developers query available simulators, retrieve live or saved logs with filters, manage log streams, and list discovered lanes directly within their IDE environment. This integration enables AI assistants to “read” live log streams gaining context from app’s current state and actively suggesting code fixes, identifying root causes, or explaining error patterns as they happen. The MCP server architecture bridges gap between standalone log viewers and integrated development environments powered by AI creating unprecedented debugging workflows.
- Export Logs in Multiple Professional Formats: Easily share findings or archive debugging sessions with versatile export capabilities. Logs export in Markdown (human-readable formatted reports), JSON (structured data for programmatic analysis), CSV (spreadsheet-compatible tabular format), and plain text (universal compatibility) enabling integration with team communication tools, documentation systems, or automated analysis pipelines. Export functionality is Pro feature requiring \$9.99 one-time purchase, with Free tier providing limited session saving (3 saves per week).
- Memory and CPU Monitor for Performance Tracking: Keep close eye on app’s performance with dedicated Memory Monitor displaying real-time resource utilization alongside logs. This integrated performance tracking helps identify memory leaks, excessive CPU usage, resource spikes correlated with specific operations, and performance inefficiencies during development before they impact users. The visual correlation between log events and performance metrics accelerates identifying which code paths cause performance problems. Memory Monitor is Pro feature requiring paid upgrade.
- Advanced Search and Filtering Capabilities: Better Logger provides robust search functionality enabling quick location of specific log entries through keyword matching, regular expression patterns, subsystem filtering, process filtering, and time-range restrictions. The filtering system works seamlessly with lane organization allowing developers to narrow focus progressively (first selecting relevant lane, then applying text filters within that lane) finding needles in haystacks of log data efficiently.
- Session Management and Replay: The application supports saving debugging sessions capturing entire log sequences for later review, sharing with team members, or comparison against subsequent test runs. Saved sessions preserve lane organization, applied filters, and temporal context enabling returning to exact debugging state without re-executing test scenarios. This capability proves invaluable for intermittent bugs, team collaboration scenarios where multiple developers investigate same issue, or archiving reproduction steps for bug reports.
- Custom Format Parsing: Beyond standard iOS log formats, Better Logger supports custom format parsing adapting to specialized logging frameworks, third-party SDKs with unique output patterns, or organization-specific log conventions. This flexibility ensures comprehensive log capture regardless of which logging approaches applications employ preventing information loss from unsupported formats.
How It Works
Better Logger operates through sophisticated macOS-native architecture optimized for iOS development workflows:
Step 1: Automatic Simulator Detection and Connection
Upon launch, Better Logger scans for running iOS Simulators using macOS system APIs communicating with Xcode’s simulator infrastructure. The application establishes direct connections to detected simulators fetching log data streams in real-time without requiring manual configuration or network setup. As new simulators start or existing ones stop, Better Logger automatically updates available devices providing seamless multi-simulator debugging workflows.
Step 2: Real-Time Log Streaming and Parsing
Once connected, Better Logger continuously streams log data from selected simulators capturing both system-level and application-specific log entries. The application employs intelligent parsing heuristics analyzing each log entry’s metadata (subsystem, category, process, severity level, timestamp) and content (message text, structured data, error codes) to extract structured information from raw log output. This parsing occurs with minimal latency ensuring live logs display nearly instantaneously as they’re generated.
Step 3: Automated Lane Organization
Based on parsed log characteristics, Better Logger’s categorization engine automatically assigns entries to appropriate lanes following configurable rules or machine-learned patterns. The color-coded visual lanes provide instant recognition of log types—developers immediately see which subsystems are active, which generate errors, which produce high volumes of output. Users can manually adjust lane assignments, create custom lanes with specific filtering criteria, or let the automatic categorization handle organization based on observed log patterns.
Step 4: Interactive Filtering and Search
Within the Better Logger interface, developers apply filters narrowing displayed logs through text search, subsystem selection, severity level filtering, time-range restrictions, or lane toggling. The responsive UI updates instantly showing only matching entries enabling rapid drill-down from thousands of logs to specific relevant messages. Advanced search supports regular expressions for pattern matching and multi-criteria filtering combining multiple conditions.
Step 5: MCP Server Exposure for AI Integration
Better Logger runs embedded MCP server exposing log data and control functions through standardized protocol. When MCP-compatible IDE like Cursor connects to Better Logger’s MCP server, it gains programmatic access to live log streams, saved sessions, discovered lanes, and device information. AI assistants within these IDEs can query “what errors appeared in the last minute?”, “show me network-related logs”, or “explain this crash” with Better Logger providing contextual log data enabling AI to generate informed responses grounded in actual application behavior.
Step 6: Performance Monitoring Integration
For Pro users, the Memory Monitor continuously samples resource utilization from connected simulators displaying real-time graphs of memory consumption and CPU usage. These performance metrics display alongside logs with synchronized timelines enabling visual correlation between specific log events and resource spikes—developers instantly see which operations caused memory increases or CPU throttling.
Step 7: Session Export and Sharing
When debugging sessions conclude, Pro users export captured logs and associated metadata in chosen formats. The export process packages filtered log entries, lane configurations, timestamps, and optional performance data into portable files suitable for sharing via email, Slack, documentation wikis, or bug tracking systems. Markdown exports generate human-readable formatted reports; JSON exports provide structured data for automated analysis; CSV enables spreadsheet import for quantitative analysis.
Use Cases
Given its specialized iOS-focused capabilities, Better Logger addresses various scenarios where traditional log viewing creates development bottlenecks:
Accelerated Debugging Reducing Investigation Time:
- Diagnosing crashes, hangs, or unexpected behaviors in iOS applications significantly faster than Console.app by isolating relevant log entries through lane organization
- Tracking multi-threaded issues where different threads generate interleaved log entries requiring visual separation for comprehension
- Following network request flows from initiation through response handling across multiple subsystems generating disparate log entries
- Identifying which third-party frameworks generate errors or warnings without manually filtering through entire system logs
AI-Powered Bug Fixing with Contextual Analysis:
- Asking AI assistants like Cursor to “explain this crash” with assistant analyzing live logs through MCP integration providing informed explanations grounded in actual error sequences
- Requesting “suggest fixes for this memory leak” with AI examining memory allocation patterns visible in logs alongside Memory Monitor data generating targeted code recommendations
- Enabling AI to proactively monitor logs during test execution alerting developers to suspicious patterns, repeated warnings, or error sequences indicating deeper problems
- Leveraging natural language queries like “why is startup taking 5 seconds?” with AI correlating log timestamps, subsystem initialization order, and performance metrics suggesting optimization opportunities
Real-Time Performance Monitoring During Development:
- Proactively tracking app’s memory usage throughout feature development catching memory leaks immediately rather than discovering them later during QA or production
- Monitoring CPU utilization during UI interactions, animations, or computation-heavy operations ensuring responsive user experiences
- Correlating performance degradation with specific code paths by observing which log events precede resource spikes
- Establishing performance baselines for routine operations detecting regressions when subsequent commits increase resource consumption
Team Collaboration with Structured Log Sharing:
- Sharing clear, organized log exports with remote team members enabling asynchronous debugging collaboration without requiring screen-sharing sessions
- Creating reproducible bug reports including exact log sequences, lane configurations, and performance data helping QA teams communicate issues to engineers effectively
- Archiving debugging sessions for future reference when similar issues recur months later providing historical context accelerating resolution
- Maintaining knowledge base of common error patterns with associated log exports and resolutions helping onboard new team members faster
Complex Multi-Module Application Debugging:
- Managing logs from large applications with numerous frameworks, services, and components using lanes to segregate different architectural layers
- Following request flows through client→network→persistence→business logic with each layer generating logs in dedicated lanes providing end-to-end visibility
- Debugging third-party SDK integration issues isolating framework-specific logs from application logic simplifying vendor support interactions
- Coordinating logs across multiple simultaneously running simulator instances testing multi-device scenarios like message synchronization or peer-to-peer communication
Pros \& Cons
Advantages
- Specialized for iOS Development Workflows: Designed from ground up specifically addressing iOS developers’ needs rather than generic log viewer adapted for mobile development. The iOS Simulator integration, lane-based organization reflecting iOS subsystem architecture, and understanding of Xcode development workflows provide tailored experience impossible with platform-agnostic tools.
- Superior User Interface with Visual Lane Organization: The visual lanes feature offers dramatically more intuitive and organized log viewing experience compared to standard console applications presenting monolithic text streams. Color-coded categorization, dynamic lane toggling, and visual density reduction transform overwhelming log floods into manageable, scannable information displays accelerating comprehension and issue identification.
- Cutting-Edge AI Integration Through MCP: The Model Context Protocol support opens powerful new possibilities for AI-assisted debugging unavailable in traditional log viewers. Enabling AI assistants to analyze live logs, suggest fixes based on actual runtime behavior, and explain errors using contextual information represents paradigm shift from manual log interpretation to AI-augmented troubleshooting—potentially reducing debugging time by significant margins.
- Native macOS Application Performance: Built using SwiftUI as native Mac application ensures optimal performance leveraging platform-specific optimizations, responsive UI without web-based lag, seamless integration with macOS features (keychain for security, native file pickers, system notifications), and low resource overhead compared to Electron-based cross-platform alternatives.
- One-Time Pro Purchase Avoiding Subscriptions: The \$9.99 lifetime Pro purchase provides permanent access to advanced features without recurring monthly fees draining budgets over time. This pricing model compares favorably to subscription-based developer tools accumulating hundreds or thousands of dollars over years of use, making Better Logger accessible to indie developers and small teams with limited budgets.
- Active Product Hunt Community Validation: The December 7, 2025 launch achieving 160 upvotes and ranking #5 for the day demonstrates market interest and community validation beyond solo developer advocacy. This social proof reduces adoption risk indicating other developers find value justifying evaluation investment.
Disadvantages
- Niche Market Limited to iOS Developers: Primarily beneficial for iOS developers using Xcode and iOS Simulators; less relevant for Android developers, web developers, backend engineers, or other platform specialists. Organizations with diverse technology stacks cannot standardize on Better Logger across entire engineering teams limiting cross-platform debugging workflow consistency.
- Mac Required Excluding Windows and Linux Users: Functionality strictly limited to macOS users (14.6 Sonoma or later) preventing access for developers on Windows or Linux regardless of interest. Cross-platform teams with mixed operating systems face adoption friction where some engineers can leverage Better Logger while others cannot, creating workflow inconsistencies and knowledge silos.
- Free Version Limitations May Hinder Evaluation: The free tier restricts lanes (2 maximum), session saves (3 per week), and MCP calls (3 per day) potentially limiting ability to fully evaluate Better Logger’s value proposition before purchase. Developers working on complex applications or teams wanting comprehensive trials may hit limitations quickly affecting assessment of whether Pro upgrade justifies investment.
- iOS Simulator Only, No Physical Device Support: Currently Better Logger specializes exclusively in iOS Simulator log streaming without supporting physical iOS device logging. Developers debugging device-specific issues (hardware integration, performance on actual processors, carrier network behavior, device-specific bugs) cannot use Better Logger requiring fallback to Console.app or alternative tools diminishing unified workflow benefits.
- Early-Stage Product with Limited Track Record: Launched December 2025, Better Logger lacks extensive production track record, large user community, comprehensive documentation ecosystem, or proven reliability over extended usage. Early adopters face risks around undiscovered bugs, evolving APIs, feature gaps becoming apparent through real-world use, or potential abandonment if commercial viability doesn’t materialize.
- MCP Integration Limited by IDE Compatibility: While MCP represents standardized protocol, practical AI-assisted debugging depends on which IDEs implement MCP client support. Currently Cursor provides documented support; other popular iOS development environments (Xcode, AppCode, VS Code with Swift extensions) may lack MCP integration limiting Better Logger’s AI capabilities to specific IDE choices rather than universal availability.
How Does It Compare?
Better Logger vs. Apple Console.app
Console.app is Apple’s built-in macOS utility for viewing system and application logs included free with every Mac.
Cost:
- Better Logger: Free tier with limitations; Pro \$9.99 one-time purchase
- Console.app: Free; included with macOS
Log Organization:
- Better Logger: Visual lane-based categorization with color coding; automatic intelligent parsing
- Console.app: Chronological list view; manual filtering through search/predicate syntax
Real-Time Streaming:
- Better Logger: Optimized real-time simulator streaming with automatic device detection
- Console.app: Real-time streaming available but less iOS-development-optimized
UI/UX:
- Better Logger: Modern SwiftUI interface designed specifically for iOS debugging workflows
- Console.app: Generic system utility interface unchanged for years; less intuitive for development-focused usage
AI Integration:
- Better Logger: MCP protocol enabling AI assistants to analyze logs programmatically
- Console.app: No AI integration; purely manual log interpretation
Performance Monitoring:
- Better Logger: Integrated Memory/CPU Monitor (Pro) alongside logs
- Console.app: No integrated performance monitoring
Export:
- Better Logger: Multiple formats (Markdown, JSON, CSV, text) via Pro
- Console.app: Basic text export only
When to Choose Better Logger: For iOS-focused development, when visual organization accelerates debugging, or when AI-assisted workflows provide value.
When to Choose Console.app: For zero-cost solution, system-wide logging beyond iOS Simulators, or when familiar Console.app workflows suffice.
Better Logger vs. Pulse
Pulse (by kean.blog) is an open-source persistent logging framework and viewer for Apple platforms focusing on network debugging and long-term log retention.
Architecture:
- Better Logger: Standalone macOS log viewer streaming from iOS Simulators; does not require code integration
- Pulse: Embedded logging framework requiring code integration into app; companion macOS/iOS viewer apps
Integration Approach:
- Better Logger: Zero code changes; works with standard OSLog output from any app
- Pulse: Requires adding Pulse framework to project, replacing/supplementing logging calls
Log Persistence:
- Better Logger: Session-based with optional saving (Pro feature)
- Pulse: Persistent local database storing logs indefinitely; comprehensive historical analysis
Network Debugging:
- Better Logger: General log viewing; network logs visible if app logs them
- Pulse: Specialized network debugging with request/response inspection, timeline visualization, HAR export
Device Support:
- Better Logger: iOS Simulators only currently
- Pulse: Both simulators and physical devices; logs persist on-device accessible via viewer apps
AI Integration:
- Better Logger: MCP protocol for AI assistant access
- Pulse: No AI integration features
Pricing:
- Better Logger: Free with limitations; Pro \$9.99 one-time
- Pulse: Open-source (free); optional Pulse Pro features with licensing
When to Choose Better Logger: For simulator-focused development, AI-assisted debugging, or when zero-code-integration requirement avoids project modifications.
When to Choose Pulse: For comprehensive network debugging, physical device logging, persistent historical analysis, or when open-source licensing matters.
Better Logger vs. CocoaLumberjack
CocoaLumberjack is a fast, flexible logging framework for iOS/macOS applications providing extensive customization but requiring code integration.
Product Type:
- Better Logger: Log viewer application; no app code changes required
- CocoaLumberjack: Logging framework library; requires integrating into project code
Usage Model:
- Better Logger: External tool analyzing logs from any app using standard OSLog
- CocoaLumberjack: Embedded solution replacing/supplementing standard logging with custom framework
Customization:
- Better Logger: Viewer customization through lanes, filters, and UI preferences
- CocoaLumberjack: Extensive programmatic customization: log levels, formatters, destinations, filters at code level
Setup Complexity:
- Better Logger: Download app, launch, connect to simulator—minutes to start
- CocoaLumberjack: Add dependency, configure loggers, update logging calls throughout codebase—hours to integrate
Performance:
- Better Logger: Viewing performance optimized; does not affect app performance
- CocoaLumberjack: Logging performance optimized for high-throughput scenarios; minimal app overhead
AI Capabilities:
- Better Logger: MCP integration for AI-assisted analysis
- CocoaLumberjack: No AI features; purely logging infrastructure
Device Support:
- Better Logger: iOS Simulators currently
- CocoaLumberjack: All platforms where app runs; logs wherever app executes
When to Choose Better Logger: For external log viewing without code changes, simulator-focused workflows, or AI-assisted debugging.
When to Choose CocoaLumberjack: For advanced logging requirements needing custom formatters/destinations, high-performance scenarios, or when embedding logging framework provides architectural benefits.
Better Logger vs. NSLogger (Legacy)
NSLogger is older iOS/Mac logging framework and desktop viewer providing network-based log streaming, largely superseded by modern alternatives.
Maintenance Status:
- Better Logger: Actively developed; launched December 2025
- NSLogger: Legacy project; last significant updates years ago
Modern Features:
- Better Logger: AI integration via MCP, modern SwiftUI interface, iOS Simulator optimization
- NSLogger: Network-based logging, desktop viewer—no recent innovation
Setup:
- Better Logger: Zero app code changes for standard OSLog
- NSLogger: Requires embedding NSLogger framework and configuring network logging
Current Relevance:
- Better Logger: Built for modern iOS development workflows (2025)
- NSLogger: Designed for earlier iOS versions before OS log improvements
When to Choose Better Logger: For modern iOS development; active maintenance matters; zero-integration requirement.
When to Choose NSLogger: For legacy projects already using NSLogger where migration costs outweigh benefits; specific network logging requirements.
Final Thoughts
Better Logger represents meaningful advancement in iOS debugging tooling by addressing persistent frustrations with traditional log viewing approaches. The December 7, 2025 Product Hunt launch (160 upvotes, #5 ranking) validates market demand for specialized iOS developer tools going beyond Apple’s generic Console.app to provide workflow-optimized solutions. For iOS developers spending hours weekly debugging simulators, the visual lane organization alone justifies evaluation—transforming overwhelming log streams into scannable, categorized information displays accelerates issue identification measurably.
The Model Context Protocol integration represents genuinely innovative capability distinguishing Better Logger from established alternatives. While network-focused tools like Pulse and logging frameworks like CocoaLumberjack serve important niches, Better Logger’s MCP implementation enables entirely new workflows where AI assistants analyze live logs, explain errors contextually, and suggest fixes grounded in actual runtime behavior rather than generic pattern matching. This AI-augmented debugging paradigm—where developers converse with assistants understanding application state through log access—may fundamentally transform how debugging occurs as MCP adoption spreads across development tools.
The platform particularly excels for:
- iOS developers primarily working in simulators during feature development, unit testing, and integration testing where physical device debugging is less frequent
- Teams using AI-powered IDEs like Cursor seeking to leverage AI capabilities beyond code completion into active debugging assistance
- Developers frustrated by Console.app’s generic interface wanting iOS-workflow-optimized experience with visual organization matching how they mentally categorize logs
- Small teams and indie developers appreciating one-time \$9.99 Pro pricing versus subscription tools draining budgets monthly
- Engineers debugging complex multi-module applications where lane-based organization separating subsystems provides essential clarity impossible in monolithic streams
For comprehensive network debugging with request/response inspection, Pulse provides specialized capabilities Better Logger’s general log viewing doesn’t replicate. For physical device logging currently unsupported by Better Logger, traditional Console.app or Pulse remain necessary fallbacks. For teams requiring extensive logging customization through embedded frameworks, CocoaLumberjack’s code-level control justifies integration complexity despite lacking Better Logger’s external viewer convenience.
But for the specific intersection of “iOS Simulator debugging,” “visual lane organization,” and “AI-assisted analysis via MCP,” Better Logger addresses capabilities no macOS alternative currently combines. The platform’s primary limitations—iOS Simulator exclusivity without physical device support, macOS-only availability excluding cross-platform teams, free tier restrictions potentially limiting evaluation, and early-stage product status lacking extensive track record—reflect expected constraints of specialized first-generation tools focusing deeply on specific workflows rather than attempting universal coverage.
The critical value proposition centers on time savings: if visual lane organization and AI-assisted debugging each save 10-15 minutes daily (conservative estimates for active iOS developers), Better Logger generates 40-60 minutes weekly productivity gains. At typical developer hourly rates (\$50-150), the \$9.99 Pro investment pays for itself within days or weeks through time savings alone, making economic justification straightforward for professional developers.
If iOS Simulator debugging consumes meaningful daily time, if Console.app’s interface frustrates through poor organization, if you use AI-powered IDEs like Cursor wanting debugging integration, or if \$9.99 represents trivial investment for potential productivity gains—Better Logger merits immediate evaluation. The free tier enables risk-free trial determining whether lane organization and workflow improvements justify Pro upgrade before financial commitment.
For early adopters accepting simulator-only limitations and recent launch status, Better Logger delivers on its promise of modernizing iOS debugging through superior organization and pioneering AI integration—potentially transforming log analysis from tedious manual interpretation into structured, AI-augmented workflows where insights emerge faster and fixes implement sooner.