
Overview
Tired of spending hours wrestling with complicated design software to create engaging infographics? Charts Not Chapters offers a refreshing solution. This AI-powered tool transforms your text, images, videos, and PDFs into visually compelling charts, saving you time and effort. Unlike traditional template-driven platforms, Charts Not Chapters leverages generative AI to give you unparalleled control over every aspect of your infographic, from layout to color. Let’s dive into what makes this tool stand out.
Key Features
Charts Not Chapters boasts a range of features designed to simplify and enhance the infographic creation process:
- AI-driven infographic creation: The core of the tool lies in its intelligent AI, which automatically generates infographics based on your input.
- Text-to-chart transformation: Easily convert written content into visually appealing charts, perfect for summarizing reports or highlighting key data points.
- PDF/image/video conversion: Transform existing documents, images, and even video content into engaging visual representations.
- Customizable layout and color: Fine-tune every detail of your infographic to match your brand and style, ensuring a polished and professional look.
- Auto-style recommendation: Receive AI-powered suggestions for optimal styling, helping you create visually appealing and effective charts.
- No fixed templates: Enjoy complete creative freedom with a platform that doesn’t restrict you to pre-designed templates.
How It Works
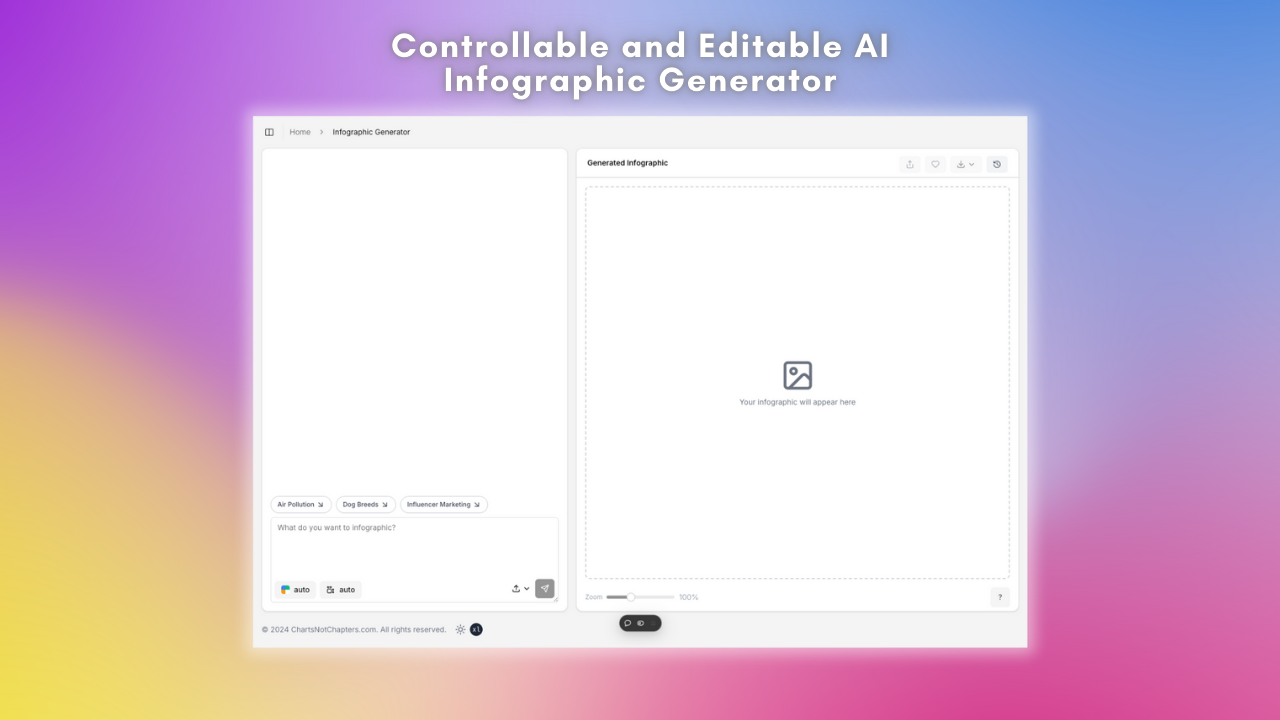
Creating infographics with Charts Not Chapters is a straightforward process. First, you upload your text or media content, whether it’s a document, image, or video. The AI then analyzes the input, identifying key data points and relationships. Based on this analysis, it generates an infographic, selecting the optimal chart type and layout to best represent the information. Finally, you can fine-tune the design elements, adjusting the size, theme, color palette, and other details to achieve your desired aesthetic.
Use Cases
Charts Not Chapters offers a wide range of applications across various fields:
- Data storytelling: Transform complex datasets into engaging visual narratives that are easy to understand and share.
- Report summarization: Condense lengthy reports into concise and visually appealing infographics, highlighting key findings and insights.
- Social media visuals: Create eye-catching graphics for social media platforms, capturing attention and driving engagement.
- Presentation graphics: Enhance your presentations with visually compelling charts and diagrams that effectively communicate your message.
- Educational content design: Develop engaging educational materials that make learning more interactive and memorable.
Pros & Cons
Like any tool, Charts Not Chapters has its strengths and weaknesses. Here’s a breakdown:
Advantages
- Highly customizable, allowing for complete creative control.
- Handles diverse input types, including text, images, videos, and PDFs.
- Saves time on design by automating the initial infographic creation process.
Disadvantages
- Limited template previews, which might make it harder for some users to get started.
- May require some design sense for best output, as the AI provides a starting point but doesn’t replace creative input entirely.
How Does It Compare?
When considering infographic creation tools, it’s helpful to see how Charts Not Chapters stacks up against the competition.
- Canva: While Canva offers a wide range of templates, it’s less focused on AI-driven creation and customization.
- Infogram: Infogram specializes in structured charts but supports fewer input types compared to Charts Not Chapters.
- Visme: Visme provides a broader suite of presentation tools but offers less diversity in terms of input types than Charts Not Chapters.
Final Thoughts
Charts Not Chapters offers a compelling solution for anyone looking to create visually engaging infographics quickly and efficiently. Its AI-powered approach, combined with its high degree of customization, sets it apart from template-driven alternatives. While some design sense may be required to achieve optimal results, the time savings and creative freedom offered by Charts Not Chapters make it a valuable tool for data storytellers, marketers, educators, and anyone looking to communicate information visually.