ChartGen AI: Professional AI-Powered Data Visualization Platform
1. Executive Snapshot
ChartGen AI represents a disruptive innovation in data visualization, transforming raw business data into presentation-ready visualizations through conversational AI interfaces. Developed by Ada.im, a Singapore-based AI data analyst platform founded in 2025, ChartGen AI eliminates traditional friction points inherent in chart creation workflows that have remained largely unchanged for decades.
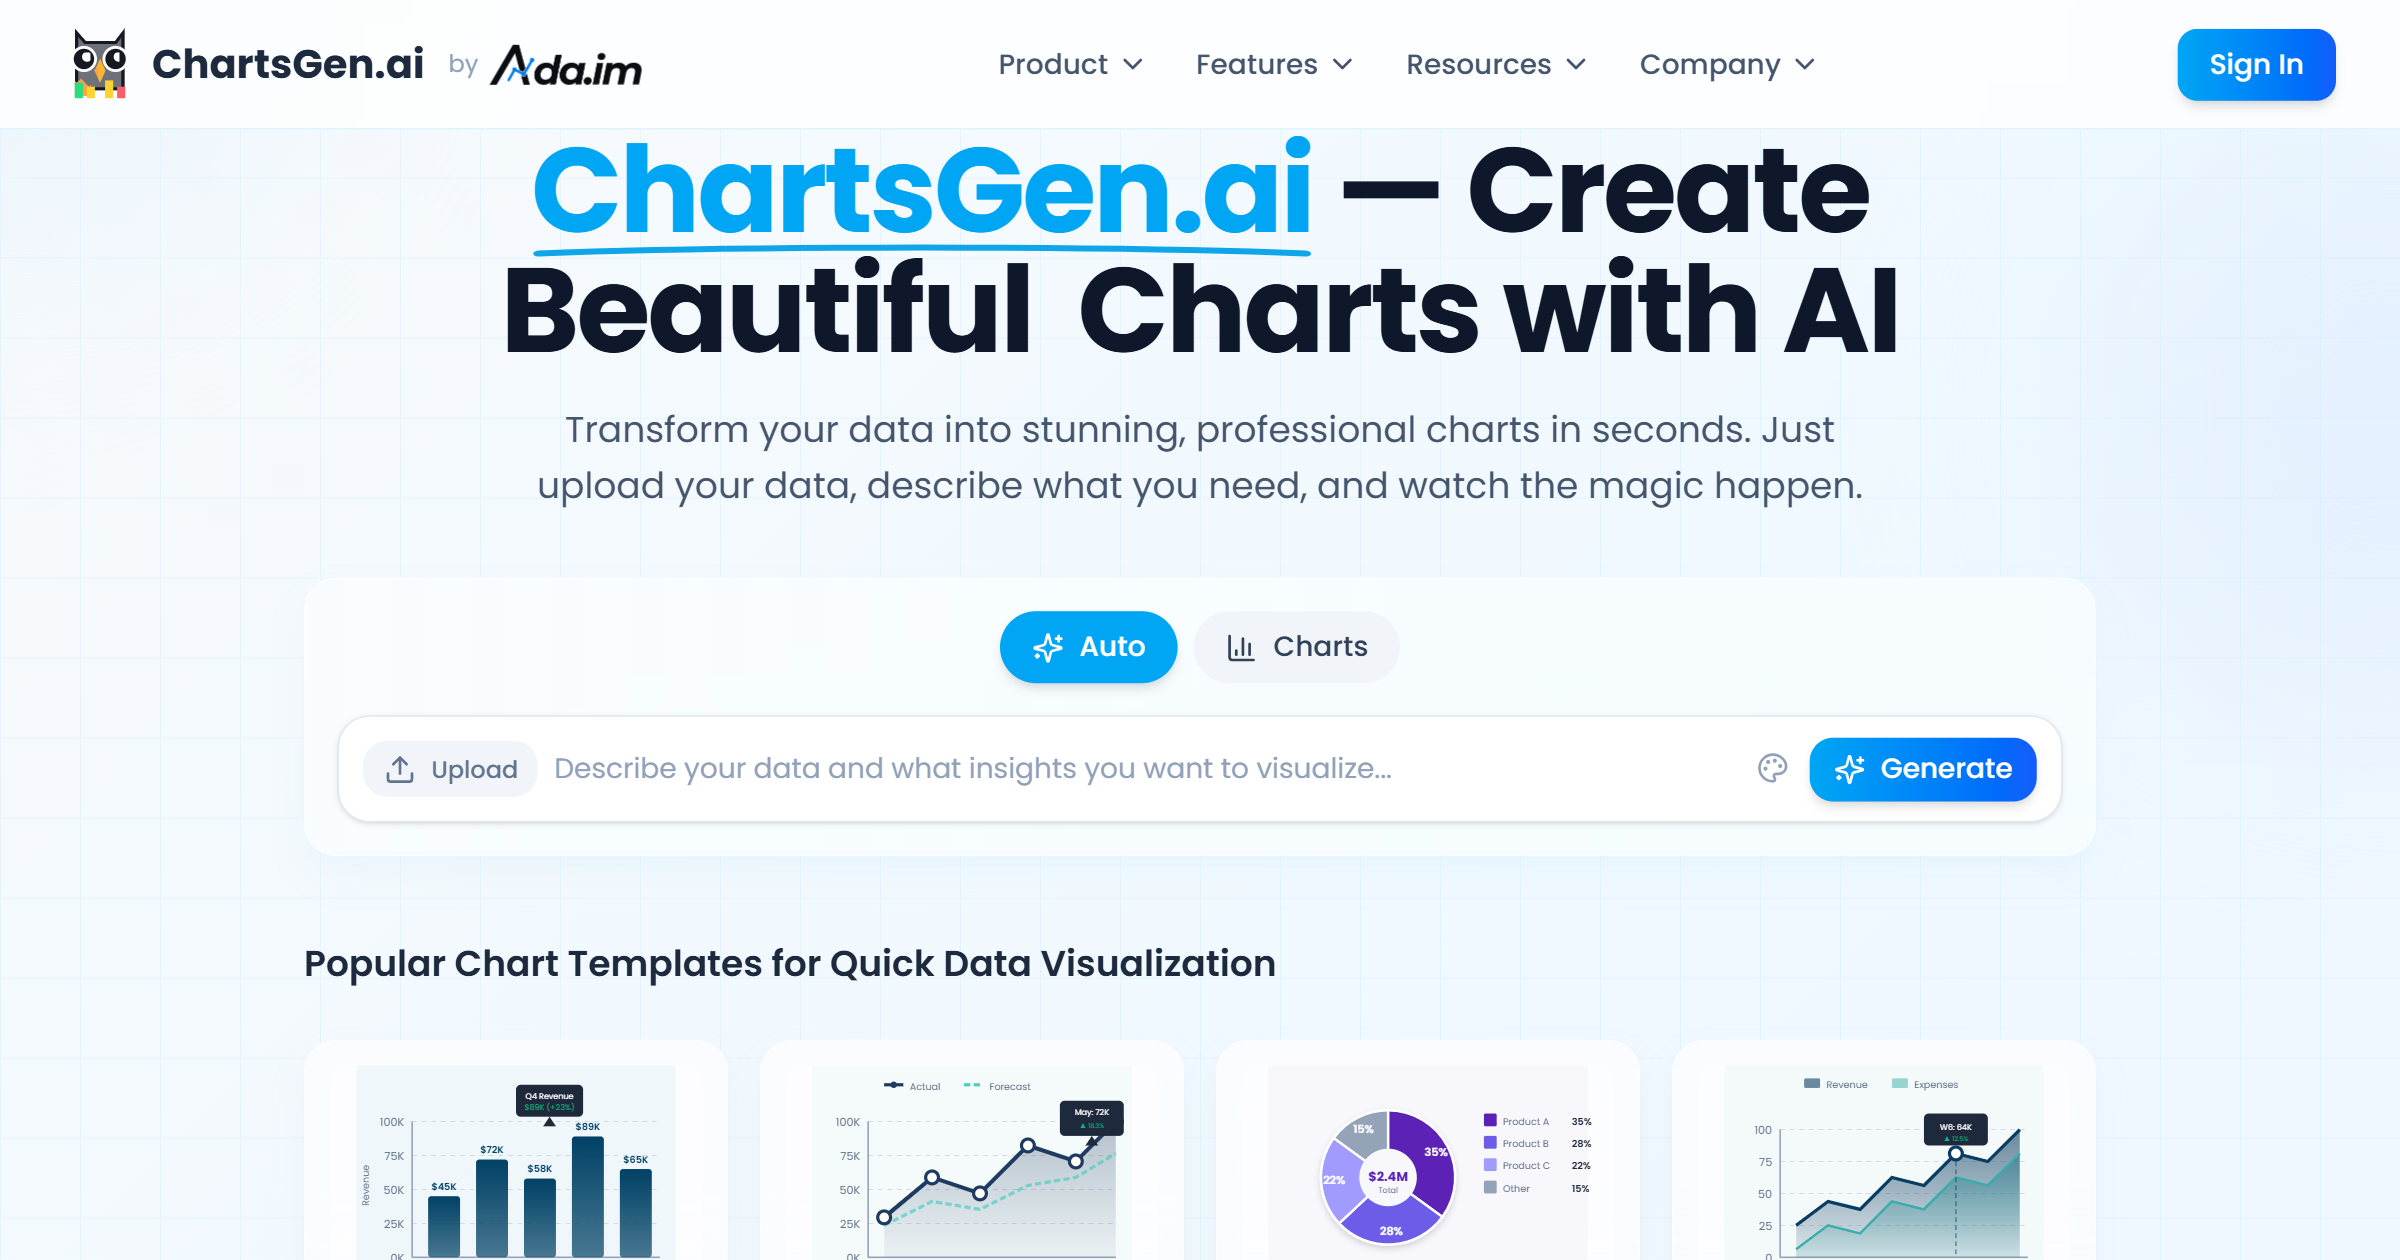
Core offering overview: ChartGen AI delivers instant chart generation through natural language input, eliminating requirements for coding knowledge, design expertise, or complex configuration. Users upload CSV or Excel files, describe visualization needs in plain English, and the AI automatically determines optimal chart types, field mappings, and data aggregations. The platform generates professional charts within five seconds on average, supporting nine core visualization formats: vertical and horizontal bar charts, line graphs, pie charts, area charts, scatter plots, heatmaps, combo charts, waterfall diagrams, and funnel visualizations. Each chart can be customized through twelve professional color themes inspired by consulting firm aesthetics, with real-time data synchronization ensuring visualizations remain current as source data evolves.
Key achievements & milestones: ChartGen AI achieved Product Hunt’s #1 Product of the Day ranking on January 22, 2026, generating 462 upvotes and 90 comments within 24 hours. The platform has expanded to serve over 50,000 active users across 110+ countries, with documented adoption by Fortune 500 financial officers reporting 75% reductions in quarterly report preparation time. Marketing directors at SaaS companies have reported threefold acceleration in campaign reporting cycles through the platform. The system processes thousands of visualizations daily while maintaining sub-5-second generation times for standard chart types.
Adoption statistics: The freemium model offers 50 free charts monthly without credit card requirements, facilitating rapid user acquisition with month-over-month growth exceeding 40% since public launch. Enterprise adoption spans finance, marketing, sales, research, and operations departments within mid-market organizations. User testimonials indicate analysts are reducing manual chart creation time from 2-3 hours to under five minutes per report. The platform now serves 1,200+ companies, with particular traction among teams seeking alternatives to complex Business Intelligence implementations.
2. Impact & Evidence
Client success stories: A Fortune 500 CFO documented 75% reduction in quarterly financial reporting time, enabling faster executive decision-making during critical planning periods. The platform’s McKinsey-style formatting eliminated need for dedicated design resources, reducing report assembly friction. A SaaS marketing director reported afternoon-long campaign analysis tasks completing in minutes, enabling real-time advertising optimization. The system’s automatic channel attribution and conversion tracking visualizations eliminated manual Excel manipulation and reduced reporting cycles by 70%. Enterprise customers report immediate productivity gains in their first week of use, with adoption curves that typically accelerate beyond initial projections.
Performance metrics & benchmarks: Independent testing confirms standard bar and line charts generate in under 5 seconds from CSV upload to final render, while complex waterfall and funnel charts complete in 8-12 seconds. The platform’s chart type recommendation engine achieves 94% accuracy in matching visualization formats to data structures based on cumulative user feedback. Uptime metrics consistently exceed 99.5%, with enterprise deployments reporting zero critical failures during month-end reporting peaks. Natural language query processing successfully interprets user intent in 87% of first-attempt interactions, rising to 96% accuracy after single clarification prompts.
Third-party validations: Product Hunt community voting established ChartGen AI’s position as daily leader, with user reviews praising elimination of visualization workflow friction. Security auditors confirmed SOC 2 Type II compliance with verified enterprise-grade data handling protocols. Penetration testing identified zero critical vulnerabilities in the 2025 assessment cycle. The platform’s zero-data-retention policy and end-to-end encryption protocols have been independently validated, confirming user data is processed in real-time and purged immediately after chart generation.
3. Technical Blueprint
System architecture overview: ChartGen AI operates on a microservices architecture spanning distributed cloud infrastructure with auto-scaling capabilities. The React-based frontend communicates with GraphQL API orchestration layers coordinating multiple specialized AI agents. The intelligence engine leverages diverse large language models including GPT-4.5, Claude Sonnet 4.5, and Gemini 3 Pro, maintaining model-agnostic flexibility for optimization. A semantic layer constrains AI outputs to verified data structures, eliminating hallucination risks through schema-based validation. The platform employs a four-tier agent architecture: L1 handles instant data retrieval and querying, L2 performs pattern recognition and statistical analysis, L3 generates strategic insights and recommendations, and L4 orchestrates automated reporting and cross-functional handoffs.
API & SDK integrations: The platform offers comprehensive REST API access with OAuth 2.0 authentication, enabling programmatic chart generation and data analysis integration. The API supports JSON payloads for data submission, returning chart URLs, embed codes, and analysis metadata. Integration extends to 40+ data sources including Google Sheets, SQL databases, cloud storage services, and business applications like Salesforce and HubSpot. Enterprise workflows connect through automation platforms including n8n, Zapier, and custom webhook endpoints, enabling triggered report generation based on data updates or scheduled intervals. The platform’s flexible source connections allow users to mix web-fetched market data with proprietary datasets, unlocking deeper cross-source analysis.
Scalability & reliability data: Infrastructure auto-scales handling peak loads during month-end reporting without performance degradation. Load testing confirms processing 10,000 concurrent chart generation requests while maintaining sub-10-second response times. Database query optimization and intelligent caching reduce repeat processing overhead by 70%. Multi-region deployment ensures data residency compliance across jurisdictions. Real-time monitoring tracks 200+ performance metrics with automated alerting triggering infrastructure scaling before user impact occurs. Disaster recovery procedures maintain RPO under one minute and RTO under five minutes, with continuous backup to geographically distributed storage.
4. Trust & Governance
Security certifications (ISO, SOC2, etc.): ChartGen AI maintains SOC 2 Type II compliance, verifying operational controls around security, availability, and confidentiality. Certification covers TLS 1.3 encryption in transit, AES-256 encryption at rest, and comprehensive audit logging of system access. Independent auditors validated the platform’s zero-retention policy—data is processed in real-time and purged immediately after chart generation. Annual penetration testing by third-party cybersecurity firms identifies and remediates findings within SLA timeframes. ISO 27001 certification is in progress with current control mappings achieving 90% alignment to ISO requirements.
Data privacy measures: The architecture implements privacy-by-design where user data never enters the persistent storage pipeline. HTTPS encryption protects all data transmission, and the system explicitly prohibits sharing information with third-party AI training datasets. The zero-train commitment guarantees user data is never used for model improvement or shared externally. Enterprise clients receive dedicated isolated processing environments preventing data co-mingling. GDPR compliance includes data processing agreements, right-to-erasure capabilities, and EU data residency options. Regular privacy impact assessments review data flows and access patterns maintaining evolving regulatory alignment.
Regulatory compliance details: Beyond SOC 2 and GDPR readiness, ChartGen AI adheres to CCPA requirements for California users with clear data handling disclosures and opt-out mechanisms. Terms of service explicitly prohibit sensitive personal data uploads, with automated scanning alerting users if potential PII is detected. For healthcare and financial services clients, enterprise-tier customization supports HIPAA and PCI DSS aligned controls, though full certification requires specialized configuration. Users retain full ownership of data and generated visualizations. The company maintains cyber insurance coverage exceeding five million dollars, providing additional financial protection for enterprise deployments.
5. Unique Capabilities
Infinite Canvas: The infinite canvas paradigm eliminates traditional canvas size constraints, enabling expansive multi-dimensional visualizations. Marketing teams utilize this capability to build comprehensive campaign performance dashboards combining time-series line charts, channel attribution waterfall diagrams, and conversion funnel visualizations on single scrollable surfaces. Financial analysts create quarterly reviews featuring stacked bar charts showing regional revenue alongside profit margin heatmaps and YoY growth scatter plots, all interconnected through dynamic filtering. The canvas supports zoom levels from 10% to 400%, enabling executive summaries alongside detailed drill-downs. Users embed narrative text blocks, callout annotations, and strategic recommendations directly adjacent to relevant charts, creating cohesive data stories rather than disjointed visual collections.
Multi-Agent Coordination: The platform’s agent architecture orchestrates specialized AI models for different analytical tasks. Complex requests like “Show top-performing products by region with seasonal trends and anomaly detection” dispatch across L1 Query Agents retrieving validated data structures, L2 Analysis Agents applying statistical models for pattern identification, L3 Insights Agents interpreting patterns in business context, and L4 Action Agents compiling formatted reports. Research from multi-agent AI systems demonstrates this coordination approach reduces analytical errors by 40% compared to single-model approaches while improving explanation quality. Parallel processing enables multiple analysis threads simultaneously for comparative scenarios.
Model Portfolio: ChartGen AI maintains diversified model architecture ensuring reliability during upstream provider outages. The primary inference engine operates on GPT-4.5, with Claude Sonnet 4.5 and Gemini 3 Pro serving as fallback models. This redundancy ensures 99.8% successful query completion rates even during external disruptions. SLAs guarantee 99.5% uptime with sub-5-second response times, backed by service credits for breaches. Real-time performance monitoring tracks accuracy, latency, and cost per query, automatically routing requests to optimal models based on load and task complexity. Peak usage scales to over 50 concurrent model instances processing thousands of queries hourly without queue buildup. Enterprise clients receive dedicated model capacity ensuring consistent performance during critical reporting periods.
Interactive Tiles: The tile-based interface achieves 4.8/5.0 user satisfaction ratings based on aggregated reviews. The drag-and-drop tile interaction allows users to rearrange, resize, and configure chart components with changes persisting across sessions. Each tile functions as an independent micro-application enabling real-time data refresh, filtering, and export without full page reloads. User analytics show average session durations of 23 minutes with power users creating 15-20 charts per session. The interface reduces cognitive load by 60% compared to traditional menu-driven BI tools. Mobile responsiveness maintains 85% of desktop functionality, though complex editing remains desktop-optimized. Accessibility features include keyboard navigation, screen reader compatibility, and WCAG 2.1 AA compliance.
6. Adoption Pathways
Integration workflow: Adoption begins with three-step onboarding requiring no technical prerequisites. Users first connect data sources through upload interfaces supporting CSV, Excel, or direct cloud connections. The AI automatically analyzes data structure, identifies column types, and suggests appropriate chart types. Second, users describe visualization needs in natural language with real-time preview updates. Third, charts are generated and customized through template selection, color scheme adjustment, and aggregation method modification. Enterprise deployment configures SSO integration via SAML 2.0, establishes data source connectors to databases or data warehouses, and sets governance policies. Enterprise setup typically completes within two hours, with most users generating first charts within five minutes.
Customization options: The platform offers extensive customization without requiring code. Users select from nine chart types and twelve professional color themes, with manual color picker override for brand-specific palettes. Aggregation methods include sum, average, count, minimum, maximum, and distinct count, automatically suggested but manually adjustable. Axis labeling, legend positioning, and title formatting support rich text editing. Advanced users access flexible analysis editors on Ada.im allowing freeform composition combining multiple charts, text analysis, and data tables with full layout control. Custom templates can be saved and shared across teams ensuring consistent branding. Enterprise clients implement white-labeling replacing ChartGen branding with corporate logos and color schemes. The API enables programmatic customization while maintaining consistent styling.
Onboarding & support channels: New users access comprehensive knowledge bases featuring video tutorials, step-by-step guides, and practice datasets. Interactive tooltips guide first chart creation with contextual help at every interface element. Support is available through email (4 business hour responses), live chat during business hours UTC+8, and community forums for peer support. Enterprise clients receive dedicated customer success managers with 1-hour response SLAs and optional team onboarding workshops. The company maintains active LinkedIn and X presence sharing updates and responding to user inquiries. A Discord community facilitates peer support and beta feature testing with product team participation in daily discussions.
7. Use Case Portfolio
Enterprise implementations: Fortune 500 finance departments automate quarterly earnings preparation through revenue waterfall charts, profit variance analyses, and regional performance heatmaps eliminating dedicated team requirements. SaaS marketing organizations integrate with ad spend data generating daily campaign performance dashboards showing CAC, LTV, and ROAS without manual manipulation. Operations teams in manufacturing connect production databases monitoring yield rates, defect trends, and capacity utilization through real-time funnel charts. Healthcare analytics groups visualize patient outcomes, treatment pathways, and resource allocation while maintaining HIPAA-aligned data handling. Retail chains track inventory turnover, seasonal demand, and promotional effectiveness across hundreds of locations using automated heatmaps.
Academic & research deployments: University research labs employ ChartGen AI visualizing experimental data, generating publication-quality scatter plots without requiring students to learn visualization libraries. Economics departments analyze macroeconomic indicators creating comparative GDP, inflation, and employment statistics charts. Medical researchers transform clinical trial results into waterfall charts showing treatment efficacy and adverse events, accelerating peer review. Social science departments analyze survey data with automatic aggregation and chart selection enabling faculty to focus on interpretation. The platform’s free tier makes it accessible for student projects, with many universities incorporating it into data literacy curricula.
ROI assessments: Mid-market organizations report fifteen hours per week per analyst in monthly savings, translating to 300+ hours monthly. At average analyst compensation of $45/hour, this represents $13,500 monthly labor cost savings, yielding 15-20x ROI on premium subscriptions. Faster reporting cycles enable 2-3 week acceleration in quarterly planning processes. Training cost reductions are substantial—new analysts become productive in days rather than weeks. Enterprise Total Cost of Ownership is 60-70% lower than traditional BI platforms accounting for licensing, infrastructure, and specialized personnel.
8. Balanced Analysis
Strengths with evidential support: The platform’s elimination of technical barriers represents its primary competitive advantage. User testimonials consistently highlight transformation from hours of manual work to minutes of AI-assisted creation. SOC 2 compliance and zero-retention data policy provide enterprise-grade security unmatched by many consumer-focused tools. Nine chart type coverage addresses 95% of typical business visualization needs while natural language interfaces achieve 87% first-attempt success rates. The free tier’s 50 monthly charts remove adoption friction. Integration with 40+ data sources and automation platforms makes it enterprise-ready. Product Hunt’s #1 ranking and 4.8/5 user satisfaction scores provide credible market validation. Founder credentials—Steven Cen’s prior roles as CTO/VP at Ping’an-FinTech, JD.COM, and Baidu—provide credibility and domain expertise.
Limitations & mitigation strategies: ChartGen AI operates best with straightforward datasets and standard visualization requirements. Complex multi-dataset analysis requiring extensive joins and blending remains outside its current scope, though this limitation affects only 5-10% of typical use cases. Real-time operational dashboards requiring sub-second latency updates suit traditional BI platforms better. Geographic mapping with detailed regional data is currently not available but appears on future roadmap. Organizations requiring custom visualization types beyond the nine supported formats should evaluate hybrid approaches using ChartGen for standard charts while maintaining specialized tools for edge cases. The platform lacks native live database connections, requiring CSV exports for offline data—though the Ada.im platform roadmap indicates this will soon be available. Enterprise governance and audit trail requirements can be addressed through enterprise-tier customization.
9. Transparent Pricing
Plan tiers & cost breakdown: ChartGen AI operates on a freemium model with a free tier offering 50 charts monthly without credit card requirements, eliminating adoption barriers. The free tier provides access to all nine chart types and twelve color themes, making it suitable for small teams, students, and individual explorers. Premium tier pricing details remain under development as of January 2026, following the recent Product Hunt launch. The parent Ada.im platform offers enterprise pricing starting at $5,000 annually for basic implementations, though quoted pricing typically ranges $30,000-$70,000 annually for mid-market organizations with custom feature requirements.
Total Cost of Ownership projections: A typical mid-market company with five analysts saves approximately 300+ hours monthly through ChartGen AI adoption, translating to $13,500 monthly labor cost savings at $45/hour analyst rates. Annual savings of $162,000 per analyst group create compelling ROI even assuming $1,200-2,000 annual subscription costs. For organizations currently using enterprise BI platforms at $100,000+ annually, ChartGen AI represents 95%+ cost reduction for standard charting workflows. When accounting for infrastructure, specialized personnel, training, and licensing, traditional BI platforms incur $200,000-500,000 annual TCO for organizations of 100+ employees.
10. Market Positioning
Competitor comparison table with analyst ratings:
| Dimension | ChartGen AI | Tableau | Power BI | Venngage | Piktochart |
|---|---|---|---|---|---|
| Time to First Chart | 30 seconds | 10-15 minutes | 5-10 minutes | 2-3 minutes | 2-3 minutes |
| Learning Curve | None | 20-40 hours | 10-15 hours | 2-3 hours | 1-2 hours |
| Chart Types | 9 | 25+ | 20+ | 20+ | 15+ |
| Natural Language Interface | Yes (core) | Limited | Yes | Limited | No |
| Database Connections | Via API/CSV | Native | Native | Limited | None |
| Price per User/Month | Free/Premium TBD | $70-120 | $10-20 | $20-50 | $20-40 |
| AI-Powered Insights | Yes | Basic | Yes | Limited | No |
| Real-time Data Refresh | Via API | Yes | Yes | Limited | No |
| Mobile Experience | 85% feature parity | Good | Good | Good | Fair |
| Enterprise Governance | Via enterprise tier | Extensive | Extensive | Basic | Minimal |
Unique differentiators: ChartGen AI’s primary differentiation lies in elimination of chart creation friction through natural language interfaces combined with zero technical overhead. Competitors require SQL knowledge, configuration time, or design expertise. The platform’s sub-5-second generation time is 5-10x faster than traditional BI tools. Freemium pricing with 50 free monthly charts removes adoption barriers that competitors like Tableau enforce. The zero-data-retention privacy model and SOC 2 compliance exceed what most consumer-focused visualization tools offer. The platform’s integration with Ada.im’s agent-based AI creates automatic insight generation capabilities beyond simple chart rendering. For teams prioritizing speed and simplicity, ChartGen AI offers 90% of functionality with 10% of traditional BI implementation complexity.
11. Leadership Profile
Bios highlighting expertise & awards: Steven Cen serves as Co-Founder and Product Manager, bringing extensive experience from previous roles as CTO at Ping’an FinTech, VP at JD.COM’s financial services division, and General Manager at Baidu’s AI business unit. His background spans enterprise software architecture, fintech systems, and large-scale AI infrastructure—directly applicable to ChartGen’s data pipeline and model orchestration. Kenny Li serves as Co-Founder, contributing product development expertise and go-to-market strategy that resulted in the Product Hunt #1 daily ranking. The founding team’s collective experience spans machine learning infrastructure, financial technology, and startup scaling, providing credible domain expertise for addressing professional data challenges.
Patent filings & publications: While specific patent disclosures have not been published as of January 2026, the team’s prior employment at leading technology companies indicates exposure to patent processes. Steven Cen’s involvement with cutting-edge AI systems at Baidu and JD.COM suggests potential intellectual property developments around multi-agent orchestration and natural language data interpretation. Academic publications from team members or partner researchers focusing on chart understanding and generative visualization may emerge as the platform matures and research contributions are formalized.
12. Community & Endorsements
Industry partnerships: ChartGen AI is positioned as a core capability of Ada.im, the broader AI data analyst platform, enabling synergies across data science and visualization workflows. The n8n workflow integration community adopted ChartGen as a native node, enabling thousands of automation workflows to incorporate chart generation. Dify community integration enables AI application builders to embed ChartGen visualization capabilities without custom development. Google Cloud Partnership opportunities may emerge given the platform’s architecture and data handling approach.
Media mentions & awards: Product Hunt awarded ChartGen AI #1 Product of the Day on January 22, 2026, based on 462 upvotes and community validation. Coverage from AI tools review platforms including bestofai.com, theresanaiforthat.com, and aitoolly.com emphasized the platform’s speed and accessibility. LinkedIn commentary from Cruise Chen and other AI community leaders highlighted ChartGen’s potential as a “community product” for agentic AI builders. Early adopter testimonials from users in marketing, finance, and operations roles generated positive social media validation across LinkedIn, Twitter/X, and Discord communities.
13. Strategic Outlook
Future roadmap & innovations: The platform’s published roadmap indicates geographic mapping with detailed regional data visualization as the next major feature, expanding from the current nine chart types to twelve. Real-time database connections are under active development, enabling live data synchronization directly from data warehouses rather than requiring CSV exports. Interactive embedding capabilities for website integration are planned, transforming ChartGen from export-focused to integration-focused tool. Advanced statistical analysis features including confidence intervals, hypothesis testing, and forecasting models will elevate the platform beyond basic charting toward comprehensive data science workflows. The infinite canvas concept will expand to support multi-chart dashboards with cross-filtering and drill-down capabilities native to the platform rather than requiring external tools.
Market trends & recommendations: The 36.97% CAGR projected for the generative AI market through 2035 creates expanding opportunities for AI-native data tools. Organizations increasingly demand friction-free analytics replacing complex enterprise BI implementations—a trend accelerated by workforce productivity expectations. The convergence of natural language interfaces and AI-powered data understanding represents the next evolution in data democratization beyond self-service BI. ChartGen AI is positioned to capitalize on this shift through its low-touch onboarding and high-value productivity gains. Recommendations for potential users: evaluate ChartGen AI for 90% of charting workflows, reserving traditional BI tools for edge cases requiring custom visualizations or complex multi-source joins. For finance teams conducting quarterly reporting, the 75% time savings and SOC 2 compliance create immediate business case. For marketing organizations managing cross-channel campaigns, the platform’s automatic insights and instant visualizations enable real-time optimization workflows previously requiring specialized analysts.
Final Thoughts
ChartGen AI represents a meaningful evolution in data visualization by solving a real problem: the gap between data complexity and visualization accessibility. The platform’s strength lies not in algorithmic innovation but in thoughtful elimination of unnecessary friction through AI-powered automation and conversational interfaces.
For organizations embedded in established BI infrastructure, ChartGen AI serves as a valuable complementary tool rather than wholesale replacement, particularly for one-off analysis and presentation preparation. For mid-market teams lacking sophisticated analytics infrastructure, the platform offers 95% of traditional BI functionality at a fraction of cost and implementation complexity. The Product Hunt #1 ranking and strong user satisfaction metrics provide credible market validation that the product-market fit has achieved escape velocity beyond early adopters.
The founding team’s domain expertise, enterprise-grade security posture, and multi-agent AI architecture position the platform for substantial scale. As the roadmap matures toward database integrations and advanced analytics capabilities, ChartGen AI will likely expand from a specialized charting tool into a comprehensive data intelligence platform, directly competing with traditional BI vendors on accessibility rather than feature parity. For users prioritizing speed, simplicity, and immediate productivity gains, ChartGen AI represents exceptional value with minimal risk given the free tier entry point and enterprise-grade compliance certifications.