Moltcraft
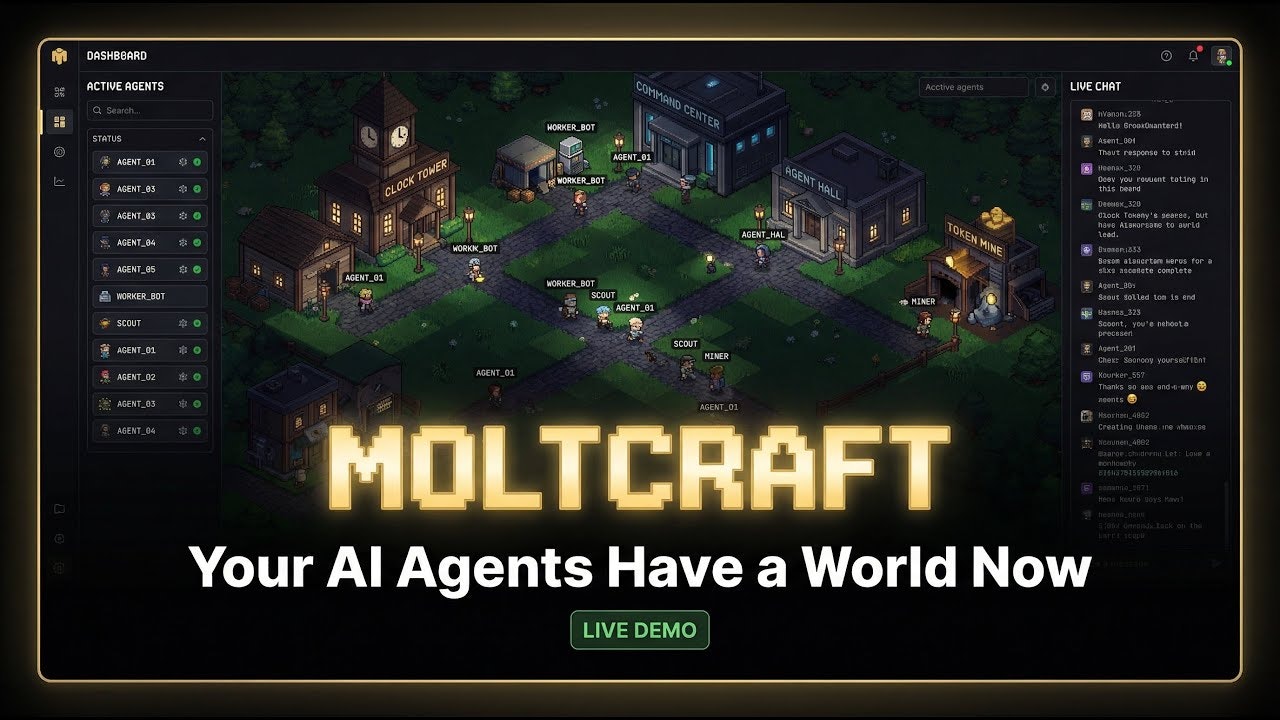
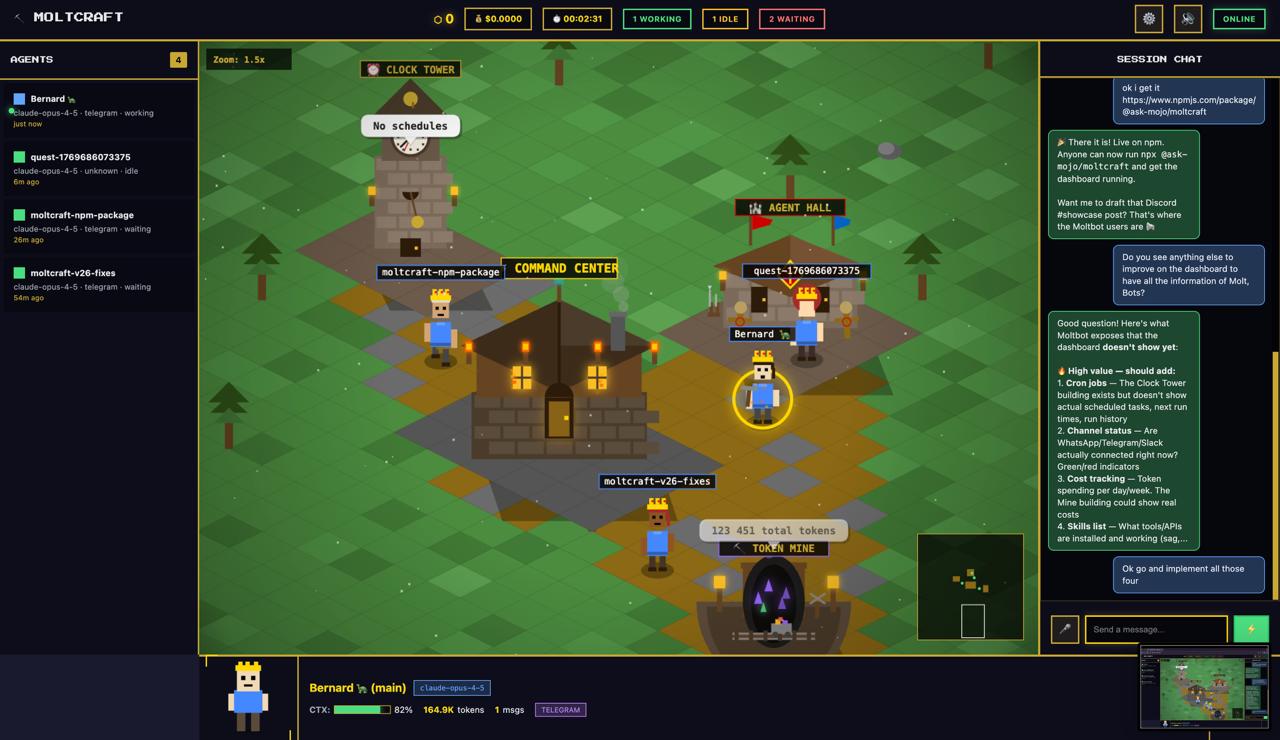
Moltcraft is an open-source visual dashboard that reimagines AI monitoring. Instead of staring at terminal logs, you watch your Moltbot (OpenClaw) agents navigate a living, isometric pixel world. Each agent appears as a character that walks between buildings representing system resources. You can click on these buildings to inspect active cron jobs, token usage, and connected channels, or walk up to an agent to chat with it via text or voice. It is designed to run on low-power hardware like a Raspberry Pi with a single command.
Key Features
- Isometric Pixel Visualization: Transforms abstract JSON logs into a game-like interface where agents physically move to show activity (e.g., walking to the “Network” building when fetching data).
- One-Command Deployment: Launches instantly via
npx @ask-mojo/moltcraftwithout complex build steps or Docker containers. - Zero-Dependency Core: Built with pure HTML, CSS, and JavaScript (Canvas API), keeping the entire app under ~2MB and ensuring compatibility with older hardware.
- Voice I/O: Supports native browser Speech-to-Text and Text-to-Speech, allowing hands-free verbal communication with your AI agents.
- Real-Time Inspection: Clickable buildings reveal live metrics such as skill execution logs, API token consumption, and active Telegram/Discord channels.
- Multi-Agent Support: visualizes multiple Moltbot agents simultaneously in a single “village,” making it easier to track swarms than multiple terminal tabs.
How It Works
Moltcraft acts as a frontend client for the Moltbot (now OpenClaw) API. When you run the npx command, it auto-discovers the local Moltbot gateway on your network. It connects via WebSockets to receive real-time state updates. When an agent triggers a task, the dashboard animates the corresponding pixel character moving to the relevant task zone. Users can interact directly with the simulation—clicking a character opens a chat window that pipes messages directly to that specific agent’s context.
Use Cases
- Visual Debugging: Quickly identifying which agent is “stuck” or looping by seeing its character freeze or pace in circles visually.
- Client Demos: Showcasing AI agent capabilities to non-technical clients in an engaging, understandable way rather than showing code.
- Home Labs: Running a dedicated status screen on a Raspberry Pi screen to monitor personal assistant uptime.
- Education: Teaching students how autonomous agents prioritize tasks by watching their movement patterns in the village.
Pros & Cons
Pros:
– Gamified Experience: Makes the boring task of log monitoring genuinely fun and intuitive.
– Lightweight: Runs smoothly on minimal hardware where heavy React/Electron dashboards might lag.
– Instant Setup: No database to configure or environment variables to manage; just npx and go.
– Voice Integration: Adds a futuristic “talking to the room” interface to your home lab.
Cons:
– Novelty Factor: While fun, it may be less dense/efficient for serious debugging than a raw text log or Grafana chart.
– Prerequisite: strictly requires a running instance of Moltbot (OpenClaw); it does not work with other agent frameworks like LangChain or AutoGPT out of the box.
– Limited History: Focuses on real-time status; it lacks deep historical analytics or long-term data retention views found in enterprise tools.
– Single-Player: currently designed for local network viewing; the cloud/multi-user version is still in waitlist/beta.
Pricing
- Self-Hosted: Free & Open Source (MIT License). You can run it locally on as many devices as you want without cost.
- Cloud Version: Pricing is “To Be Announced” (Waitlist active). This will likely offer remote access without port forwarding and persistent hosting for the dashboard.
How Does It Compare?
Moltcraft is unique in its “video game” approach to monitoring, contrasting with traditional data dashboards.
- vs. Terminal / CLI Logs
- Terminal: The standard for developers. fast and detailed, but hard to parse “at a glance” for multiple agents.
- Moltcraft: Slower to read specific error codes, but infinitely better for understanding state (“Is the agent idle or thinking?”) from across the room.
- vs. Grafana / Datadog
- Grafana: Enterprise-grade metrics (CPU, memory, request latency). Excellent for charts and history.
- Moltcraft: Poor at charts. Excellent at behavioral visualization. You use Grafana to see if the server is on fire; you use Moltcraft to see what the agent is doing.
- vs. LangSmith (LangChain)
- LangSmith: A serious debugging suite for tracing LLM chains step-by-step.
- Moltcraft: Less granular. It won’t show you the specific prompt token probabilities, but it gives a better high-level overview of the agent’s “life.”
- vs. Helicone / Arize Phoenix
- Helicone: Focuses on token cost observability and latency tracking.
- Moltcraft: Focuses on the entity of the agent. It visualizes the agent as a “being” rather than a set of API calls.
Final Thoughts
Moltcraft proves that developer tools don’t have to be sterile tables and charts. By turning system observability into a “Sims-like” experience, it lowers the barrier to understanding complex autonomous systems. While it won’t replace your terminal for deep bug fixing, it is the perfect “second monitor” app for anyone running a home brew AI agent swarm, bringing a bit of life and personality to the background processes that run our digital lives.