
Table of Contents
Routines by Databox Investment Report
Category: Business intelligence / agentic analytics / reporting automation
Company Stage: Established growth-stage private SaaS company
Founder or Founders: Davorin Gabrovec
Headquarters: Boston, Massachusetts, with a substantial operating presence in Slovenia
Funding: At least $3.3 million publicly verified; total funding is unclear
Business Model: Subscription SaaS with usage-based AI-credit limits
Product Hunt Launch Date: September 7, 2026
Report Date: September 10, 2026
| Investment Metric | Assessment |
|---|---|
| Venture Potential | 74/100 |
| Unicorn Path | Conditional |
| Valuation Attractiveness | Not Assessable |
| Evidence Confidence | 68/100 |
| Final Decision | DD |
Executive Summary
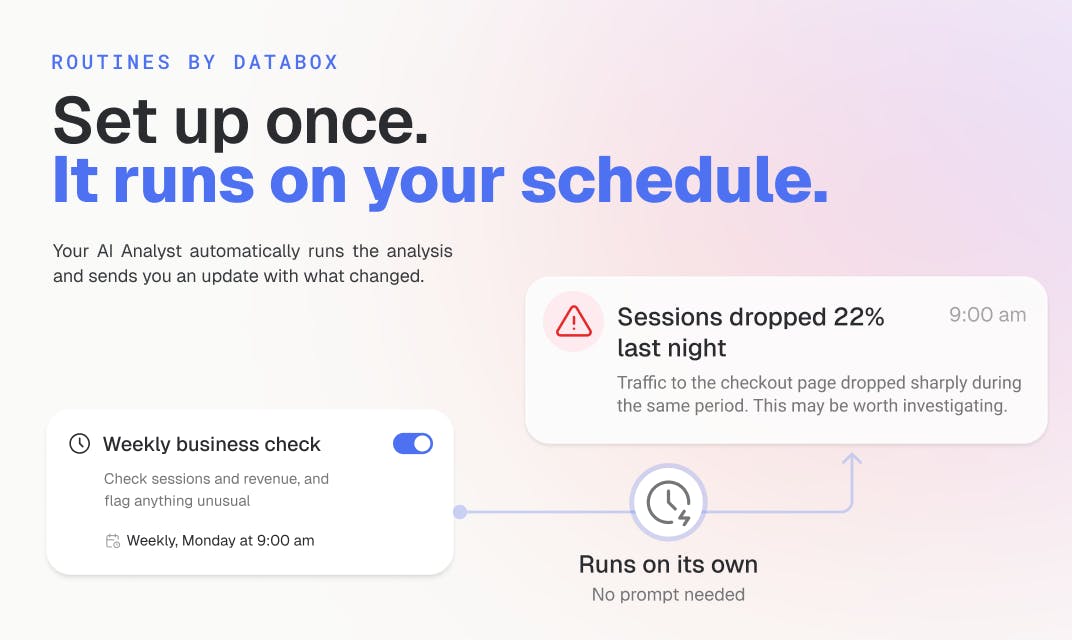
Routines is a new automation capability inside Databox’s business-intelligence platform. It lets users schedule an AI analyst to analyze connected business data, prepare a report, and distribute a summary through email, Slack, or the Databox application. Routines can run on a recurring schedule or in response to a webhook, and each execution is retained for review and follow-up questions (Routines documentation).
The product serves marketing agencies, revenue teams, operators, and growing businesses that repeatedly compile performance reports from advertising, CRM, web analytics, finance, and other systems. Its value is not merely generating another dashboard: it attempts to automate the analytical work between data collection and management action.
Product quality appears strong. Databox already has a substantial data foundation, including more than 130 integrations and over 4,000 curated metrics. The company reports that more than 20,000 businesses use its platform and that users have shared over 394,000 dashboards and reports (Databox about page). These are company-reported figures and do not reveal how many users are paying, active, or retained, but they give Routines an installed base that most new AI analytics products lack.
The strongest investment signal is therefore company quality rather than Product Hunt attention. Databox was founded in 2012, has a 65-person team according to its current careers page, has documented historical revenue milestones, and maintains numerous published customer cases (careers, customers). A 2025 CEO interview described the company as having reached approximately $10 million ARR, although current ARR and growth have not been independently verified (ResultMaps interview).
The primary concern is whether Routines creates a durable growth reacceleration or is an easily replicated feature in an intensely competitive BI market. Microsoft, Google, ThoughtSpot, AgencyAnalytics, and other platforms possess broader distribution, while LLM and workflow platforms can connect directly to underlying data. Databox must prove that its governed metrics, integrations, reusable Skills, and agency distribution produce better accuracy and retention than generic AI automation.
Decision: DD. Databox has sufficient product maturity, existing adoption, team capability, and revenue evidence to justify formal diligence. An investment decision cannot be made without current ARR, growth, retention, gross margin, AI costs, cap-table information, and financing terms.
Product Overview
The customer problem is repetitive analysis rather than simple data visualization. A marketing or revenue team may produce the same weekly review by collecting figures, checking changes, identifying causes, writing commentary, and sending the report to stakeholders. Conventional dashboard alerts typically identify that a metric moved but do not complete the broader analytical workflow.
Routines lets a user define instructions and choose a daily, weekday, weekly, monthly, or webhook trigger. The routine can reference saved analytical Skills, specific data sources, or an agency client. Results can be delivered by email or Slack and remain available in a run history for follow-up analysis (help center).
Routines sits within a broader product architecture:
- Connected data and standardized metric definitions.
- Dashboards, scorecards, goals, forecasts, and reports.
- Genie, Databox’s conversational AI analyst.
- Artifacts that turn analysis into shareable reports or documents.
- Skills that preserve analytical instructions and standards.
- Routines that execute those Skills repeatedly.
- MCP connectivity allowing external AI tools to query Databox data.
- A planned agent builder that will combine analysis, reporting, and actions (agentic analytics page).
Databox offers a free plan and paid Analyst, Pro, Growth, Agency, and Custom options. The current indexed pricing page lists Analyst at $71 per month billed annually; agency pricing begins at $79 per month billed annually, while team and growth configurations depend on data sources and AI-credit requirements (pricing). Public Databox pages contain inconsistent Analyst credit allowances—150 credits in the latest pricing search result versus 500 in some plan descriptions—so the current allowance should be verified contractually.
Routines consume AI credits on every execution. A run is skipped when the account exhausts its monthly allowance, then resumes after credits are replenished (AI credits documentation). This creates predictable cost controls but can undermine reliability if a business-critical report silently encounters an exhausted pool.
Product Quality Assessment: Strong, practical automation built on an established analytics foundation, although reliability, accuracy, and credit consumption require production-level validation.
Founder and Team Assessment
Davorin Gabrovec founded Databox and currently serves as President and Chief Product Officer. Peter Caputa joined as CEO in 2017 after leading HubSpot’s partner program; Databox states that Caputa helped grow the company from a handful of customers to 3,000 customers and previously helped scale HubSpot’s partner channel beyond $100 million in revenue (Caputa biography).
The leadership team includes executives responsible for engineering, product, sales, customer success, and operations. Databox reports 65 employees across 17 countries, while LinkedIn lists 113 associated profiles and a 51–200 employee range (careers, LinkedIn). The figures measure different things—current company-reported headcount versus LinkedIn associations—so 65 is used as the more direct operating figure.
The company has demonstrated resilience across multiple strategic transitions: enterprise mobile BI, self-service dashboards, agency reporting, and now agentic analytics. It previously acknowledged that its original enterprise positioning did not prove a sufficient market and pivoted toward freemium and agency use cases (company history). That history indicates adaptability but also shows that Databox operates in a category requiring repeated repositioning.
Founder Assessment: Experienced, commercially proven leadership with strong analytics and SaaS execution; current AI-transition performance remains to be verified.
Market Opportunity
The initial segment is marketing agencies and SMB-to-midmarket teams that aggregate performance data across multiple cloud applications but lack dedicated analytics staff. These customers already spend employee hours building reports manually or pay for agency reporting and lightweight BI platforms.
Databox’s published customer cases report substantial workflow improvements, including Raven51 saving 20 reporting hours per month, Digital Wasabi reducing onboarding time by 90%, and JARS Digital saving 10–15 reporting hours monthly. These are company-selected case studies rather than independently controlled analyses, but they demonstrate measurable customer value (customer stories).
A reasonable bottom-up scenario is:
- 250,000–500,000 globally reachable agencies and growing businesses with multi-source reporting needs.
- Annual recurring revenue of approximately $2,000–$5,000 per paying organization, depending on plan, data sources, and AI usage.
- Illustrative serviceable market of $500 million–$2.5 billion in annual revenue.
This is an analyst scenario, not a verified market-size figure. Databox’s existing claim of 20,000 businesses demonstrates reach but includes free accounts and does not establish that the high-value portion of this market is attainable.
Expansion opportunities include finance, operations, customer success, sales analytics, embedded analytics, enterprise governance, and a marketplace of expert-built Skills. The market can support venture-scale revenue, but Databox must compete both with dedicated agency-reporting tools and horizontal enterprise BI systems.
Traction and Growth Signals
Databox has materially stronger evidence than a typical Product Hunt startup:
- More than 20,000 businesses using the platform, according to the company.
- More than 70 million metrics tracked and 394,000 dashboards or reports shared.
- More than 130 data integrations (about page).
- Numerous named customer cases across agencies, software, manufacturing, and other industries (customers).
- A documented 2018 milestone of $1.1 million ARR, 5,024 monthly active users, and 35 paying customers at the beginning of the preceding growth period (company revenue retrospective).
- A 2025 interview describing Databox as having reached approximately $10 million ARR (ResultMaps).
- Product Hunt’s broader Databox listing has a 4.6/5 score from only five reviews, including one recent review specifically discussing Routines (Product Hunt reviews).
Routines ranked approximately fourth on its September 7 Product Hunt launch day and eleventh for the week (daily leaderboard, weekly leaderboard). This indicates launch interest but is not material evidence of incremental revenue or retention.
The critical missing data are current ARR, year-over-year growth, paid customer count, net revenue retention, gross retention, Routines adoption, run frequency, AI-credit top-ups, and conversion from existing plans to higher-value tiers.
Traction Assessment: Established company-level traction, but Routines-specific monetization and current financial growth are not publicly verified.
Competitive Position
Direct competitors include AgencyAnalytics, Klipfolio, Whatagraph, and other reporting platforms. Broader competitors include Microsoft Power BI, Google Looker Studio, Tableau, ThoughtSpot, Sigma, and custom warehouse-plus-dashboard configurations. Manual alternatives include spreadsheets, slide decks, and analyst-written reports.
AgencyAnalytics now includes automated reporting, AI analysis, anomaly detection, MCP access, unlimited reports, and more than 85 integrations for $20 per client per month on annual billing (AgencyAnalytics pricing). Microsoft Power BI Pro costs $14 per user monthly and benefits from Microsoft’s distribution and data ecosystem (Microsoft pricing). ThoughtSpot’s Spotter offers multi-step AI analysis, governed semantics, automated workflows, and enterprise controls (Spotter).
Databox’s defensibility rests on its integrated metric definitions, connector coverage, historical customer data, agency workflow, reusable Skills, and distribution to 20,000 reported businesses. Repeated use can raise switching costs as customers build metrics, datasets, dashboards, client structures, and analytical routines.
However, there is no conventional network effect. The Skills Marketplace may create a modest ecosystem advantage, but contribution volume, adoption, and monetization are not disclosed.
If the largest competitor launched equivalent scheduling within six months, customers would remain because migrating connected sources, metric definitions, agency-client structures, and report history is burdensome—not because scheduling itself is unique. Routines strengthens retention but is not independently defensible.
Defensibility Assessment: Medium
Business Model and Economics
Databox monetizes through tiered SaaS subscriptions, additional data sources, AI-credit top-ups, agency client packs, and negotiated enterprise plans. Publicly indexed annual pricing spans approximately $71 monthly for an individual Analyst plan to several hundred dollars monthly for higher-capability plans, with custom enterprise pricing (pricing).
Traditional dashboard and integration functionality should have attractive software gross margins. AI analysis introduces variable inference costs that increase with data volume, prompt complexity, output length, and routine frequency. Databox manages this through shared monthly credit pools, expiring unused credits, and paid top-ups.
The key economic question is whether Routines increases expansion revenue faster than it increases model and support costs. The highest-quality outcome would be higher plan upgrades and top-up revenue with limited incremental support. The weaker outcome would be heavy AI consumption by existing customers without corresponding ARPU expansion.
Enterprise economics may improve through SSO, security controls, priority support, white-labeling, and higher AI allowances. Sales efficiency and implementation costs are unknown.
Unicorn Path
An 8× ARR multiple is assumed for a scaled B2B SaaS company with durable double-digit growth, strong retention, and healthy gross margins. Mature or slower-growing BI vendors may command lower multiples; exceptional AI-led growth could command higher multiples.
Required ARR = $1 billion ÷ 8 = approximately $125 million.
Using an illustrative $2,000–$5,000 annual blended customer value, Databox would require approximately:
- 62,500 paying organizations at $2,000 ACV, or
- 25,000 paying organizations at $5,000 ACV.
The company reports 20,000 businesses using Databox, but free-versus-paid composition is unknown. If the approximately $10 million ARR cited in 2025 was accurate, reaching $125 million would require roughly 12.5× expansion from that historical level.
Achieving this outcome likely requires sustained AI-driven upselling, larger enterprise contracts, deeper agency penetration, higher-value automated agents, strong international growth, and net revenue retention materially above 100%. Routines alone is insufficient; it must become part of a broader autonomous analytics platform.
Unicorn Path: Conditional
Valuation Assessment
A $3.3 million seed round led by Founder Collective, with participation from Accomplice and other investors, was publicly reported in 2015 (TechCrunch). Founder Collective continues to list Databox in its portfolio (investor portfolio).
Third-party databases report materially different total-funding figures, ranging from approximately $3.7 million to more than $5 million; other results appear to conflate Databox with similarly named companies. The verified $3.3 million seed is therefore treated as a minimum, not the total.
No reliable current valuation, financing terms, or fundraising status was found.
Valuation Attractiveness: Not Assessable
Required information includes current ARR, growth, gross margin, retention, cash generation, burn, runway, capitalization, option pool, round size, post-money valuation, and liquidation preferences.
Key Risks
- Current revenue growth and retention are not publicly disclosed.
- Routines may be a replicable feature rather than a durable product moat.
- Microsoft, Google, and enterprise BI vendors have stronger distribution.
- AI-credit costs could compress gross margin or make scheduled analysis unreliable.
- Incorrect AI conclusions could damage customer trust and decision-making.
- The reported 20,000 businesses may include a large free or lightly engaged population.
- Moving upmarket requires stronger governance, security, and implementation capabilities.
- Agency concentration may expose Databox to client churn and marketing-budget cycles.
- Pricing and AI-credit information is inconsistent across current public pages.
- A 2012-founded company must show that agentic analytics can materially reaccelerate growth.
Final Assessment
Venture Potential: 74/100
| Category | Score |
|---|---|
| Market Size and Expansion Potential | 16/20 |
| Traction and Growth Evidence | 15/20 |
| Founder and Team | 13/15 |
| Product Strength | 9/10 |
| Distribution Potential | 10/15 |
| Business Model and Economics | 6/10 |
| Defensibility | 5/10 |
| Total | 74/100 |
The strongest elements are the installed data infrastructure, established customer base, experienced leadership, and practical workflow automation. The weakest are current financial opacity, competitive replication, and uncertain AI economics.
Evidence Confidence: 68/100
Verified evidence covers product functionality, pricing structure, historical funding, leadership, headcount, integrations, customer cases, and historical revenue milestones. Current user and usage figures are company-reported. Current ARR, growth, retention, margins, paid customer count, burn, valuation, and Routines adoption remain unavailable.
Final Decision: DD
Databox is sufficiently mature and commercially credible to justify formal due diligence. Routines could improve retention, expansion revenue, and strategic positioning, but valuation attractiveness and the scale of the AI-driven growth opportunity cannot be determined from public evidence.
Upgrade Conditions
- Verified ARR above $15 million with more than 30% annual growth.
- Net revenue retention above 110% and gross retention above 90%.
- Meaningful Routines adoption among paid accounts.
- Gross margin above 75% after AI inference costs.
- Evidence that Routines drives upgrades, credit top-ups, or lower churn.
- Repeatable midmarket and enterprise contract growth.
- Financing terms consistent with current growth and retention.
Downgrade Conditions
- ARR growth below conventional SaaS growth expectations.
- Routines adoption remaining limited to demonstrations or low-frequency use.
- AI errors causing customer churn or material reporting failures.
- AI costs materially reducing gross margin.
- Customers shifting to bundled Microsoft, Google, or agency-specific alternatives.
- Weak enterprise expansion or deteriorating agency retention.
Questions for Further Diligence
- What are current ARR, year-over-year growth, and net-new ARR?
- How many of the reported 20,000 businesses are active and paying?
- What are gross and net revenue retention by customer segment?
- What percentage of paid accounts have created an active Routine?
- How often do Routines execute, and what percentage complete successfully?
- How much inference cost and gross profit does an average routine generate?
- Does Routines materially increase upgrades, top-ups, or retention?
- What are customer acquisition cost and payback by self-service, agency, and enterprise channels?
- What controls detect hallucinations or incorrect analytical conclusions?
- What are current burn, runway, cap table, valuation, and proposed round terms?
- How much revenue is concentrated in agencies or the largest customers?
- What proprietary advantage prevents Power BI, ThoughtSpot, or AgencyAnalytics from displacing Databox?
Sources
- Routines by Databox on Product Hunt
- Official Routines documentation
- Databox agentic analytics platform
- Databox pricing
- Databox company and usage information
- Databox customer stories
- Databox careers and team information
- Historical $1.1 million ARR disclosure
- 2025 CEO interview discussing $10 million ARR
- 2015 funding announcement—TechCrunch
- Founder Collective portfolio
- AgencyAnalytics pricing
- Microsoft Power BI pricing